Aging of Population
Leonid A. Gavrilov
and Patrick Heuveline
This is a manuscript of our
article in The Encyclopedia of Population.
[Note: This original
manuscript is slightly different from the final publication because of
small
editorial changes.]
Reference
to the published article:
Gavrilov L.A., Heuveline
P.
“Aging of
Population.”
In:
Paul Demeny and Geoffrey McNicoll (Eds.)
The Encyclopedia of Population.
Aging
of population
(also known as demographic aging, and population aging)
is a
summary term for shifts in the age distribution (i.e., age
structure) of
a population toward older ages. A direct consequence of the
ongoing
global fertility transition (decline) and of mortality
decline at
older ages, population aging is expected to be among the most prominent
global
demographic trends of the 21st century. Population aging is
progressing rapidly in many industrialized countries, but those
developing
countries whose fertility declines began relatively early also are
experiencing
rapid increases in their proportion of elderly people. This pattern is
expected
to continue over the next few decades, eventually affecting the entire
world. Population aging has many important socio-economic and
health
consequences, including the increase in the old-age dependency ratio.
It presents challenges for public health (concerns over possible
bankruptcy of
Medicare and related programs) as well as for economic development
(shrinking
and aging of labor force, possible bankruptcy of social security
systems).
Defining and measuring population
aging
As the study of population aging is
often driven by a concern over its burdening of retirement systems, the
aging
of population is often measured by increases in the percentage of
elderly
people of retirement ages. The definition of retirement ages may vary
but a
typical cutoff is 65 years, and nowadays a society is considered
relatively old
when the fraction of the population aged 65 and over exceeds 8-10%. By
this
standard, the percentage of elderly people in the
A related measure of
population aging is the elderly dependency ratio (EDR): the
number of
individuals of retirement ages compared to the number of those of
working ages.
For convenience, working ages may be assumed to start at age 15,
although
increasing proportions of individuals pursue their education beyond
that age
and remain, meanwhile, financially dependent, either on the state or,
increasingly, on their parents or bank managers. The ratio of the
elderly
dependent population to the economically active (working) population is
also
known as old-age dependency ratio, age-dependency ratio
or elderly
dependency burden and is used to assess intergenerational
transfers,
taxation policies, and saving behavior.
These indicators of
population aging are mere head-count ratios (HCR), that is,
they simply
relate the number of individuals in large age categories. These
indicators fail
to take into account the age distribution within these large
categories, in
particular among the elderly. When the fertility and mortality trends
responsible for population aging have been fairly regular over time,
the
population growth is positively correlated with age (i.e., the oldest
age
groups are growing fastest). This implies that if the proportion of the
population over age 65 is increasing, within that 65-and-over
population the
proportion over, say, age 80 is also increasing. As health, financial
situation, and consumption patterns may vary greatly
between
65 year-olds and 80 year-olds, simple ratios conceal important
heterogeneity in the elderly population. Increasingly, attention is
paid to the
"oldest olds" (typically age 80 and over). A long-time subject of
curiosity,
the number of centenarians is growing even faster. Estimated at 180,000
worldwide in 2000, it could reach 1 million by 2030 (United Nations
2001).
The
second class of indicators for population aging is the group of
statistical measures
of location (median, mean and modal ages of population). The median
age
-- the age at which exactly half the population is older and another
half is
younger -- is perhaps the most widely used indicator. For the year
2000, the
median age in the
Since population aging
refers to changes in the entire age distribution, any single indicator
might
appear insufficient to measure it. The age distribution of population
is often
very irregular, reflecting the scars of the past events (wars,
depression
etc.), and it cannot be described just by one number without
significant loss
of information. Were the age distribution to change in a very irregular
fashion
over the age range, for instance, much information would be lost by a
single-index summary. Therefore, perhaps the most adequate approach to
study
population aging is to explore the age distribution through a set of
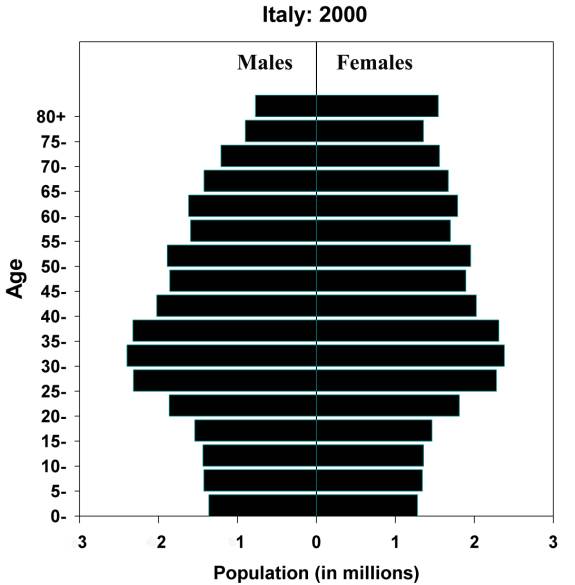
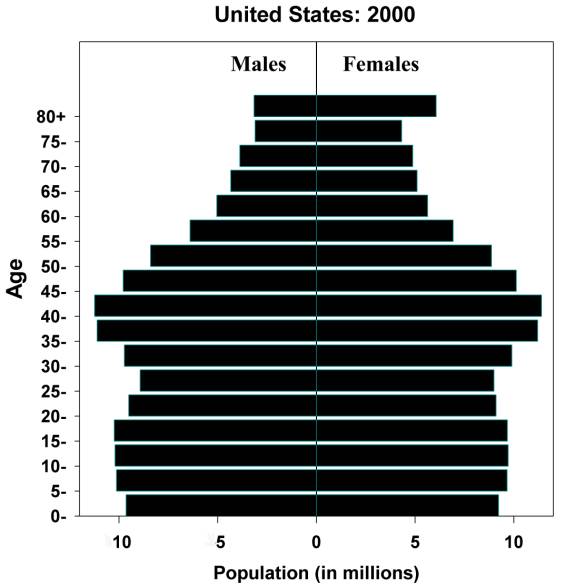
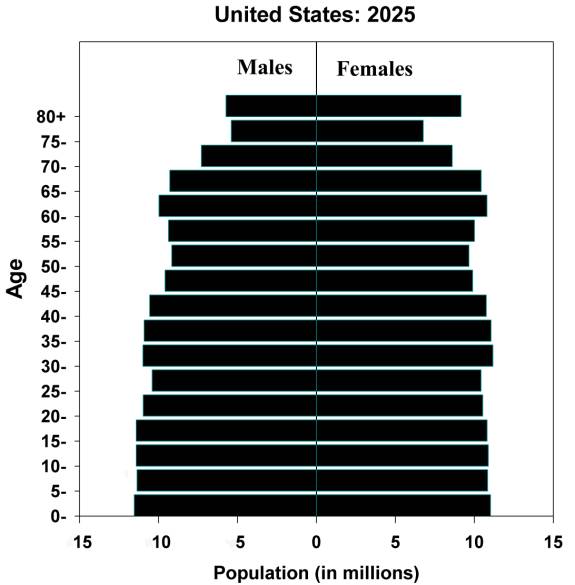
percentiles, or graphically by analyzing the population pyramids.
Demographers commonly use population pyramids to describe both age and
sex
distributions of populations. Youthful populations are represented by
pyramids
with a broad base of young children and a narrow apex of older people,
while
older populations are characterized by more uniform numbers of people
in the
age categories.
Figures 1-5 About
Here
Demographic
determinants of population aging
To understand the
demographic factors that cause population aging, demographers often
refer to stable
populations (Preston et al. 2001). This population model assumes
that
age-specific fertility and mortality rates remain constant over time,
and this results in a population with an
age distribution that
stabilizes and eventually becomes time invariant as well. Conversely,
this
theoretical model suggests that any change in age structure, and
population
aging in particular, can only be caused by changes in fertility and
mortality
rates. The influence of changes in fertility rates on population aging
is
perhaps less intuitive than that of mortality rates. Everything else
constant,
however, a fertility decline reduces the size of the most recent birth
cohorts
relative to the previous birth cohorts, hence reducing the size of the
youngest
age groups relative to that of the older ones.
The effects of
changes in mortality rates on population aging appear more intuitive,
but are
in fact more ambiguous. If increases in the human life span are
correctly linked to population aging, reductions in mortality rates do
not
necessarily contribute to population aging. More specifically,
mortality
declines among infants, children and persons younger than the
population mean
age tend to lower the population mean age. A moment of thought
suggests
that indeed a reduction of neonatal mortality (i.e., death in the first
month
of life) adds individual at age 0 and should lead to the same partial
alleviation of population aging as an increase in childbearing.
Population aging is thus
related to the demographic transition, that is
the processes that lead a society from a demographic regime
characterized by
high rates of fertility and mortality to another one with lower
fertility and
mortality rates. In the course of this transition, the age structure is
subjected to different influences. In the typical sequence, the
transition
begins with successes in preventing infectious and parasitic diseases
that
benefit infants and young children most. The resulting improvement in
life
expectancy at birth occurs while fertility tends to remain unchanged,
thereby
producing large birth cohorts and an expanding proportion of children
relative
to adults. Other things being equal, this initial decline in mortality
generates a younger population age structure.
After initial and
sometimes very rapid gains in infant and child mortality have been
achieved,
further mortality declines increasingly benefit older ages and are
eventually
accompanied by fertility declines. Both changes contribute to reverse
the early
effect of mortality decline on the age structure, and this synergy is
known as
the double aging process. This corresponds to the experience of
most
developed countries today, but further decomposition suggest that their
history
of declining mortality is the dominant factor in current aging
(Preston, Himes
and Eggers 1989). Mortality declines continue in these countries and
the
decrease in mortality rates among the oldest-old (85+ years) has
actually
accelerated since the 1950s (Gavrilov, Gavrilova, 1991). This latest phase of mortality
decline,
which is concentrated in the older age groups, is becoming an important
determinant of population aging, particularly among women.
The rate of population
aging may also be modulated by migration. Immigration
usually
slows down population aging (in
Dynamics
of population aging
The
current level and pace of population aging vary widely by geographic
region,
and usually within regions as well, but virtually all nations are now
experiencing growth in their numbers of elderly residents (for selected
regions
and countries, see Table 1). The percentage of world population
aged 65
and over only increased from 5.2% in 1950 to 6.9% in 2000. In
Table 1 About
Here
Population aging has the
following notable features:
(1) The most rapid
growth occurs in the oldest age groups – the oldest-old (80+ or 85+
years) and
centenarians (100+ years) in particular. In other words,
population aging
is becoming “deeper” with preferential accumulation of particularly old
and
frail people.
(2) Population aging is
particularly rapid among women, resulting in “feminization” of
population aging
(because of lower mortality rates among women). For example, in
the
(3) Another consequence
of lower female mortality is the fact that almost half of older women
(45%) in
2000 were widows, thus living without spousal support.
(4) Population aging
also causes changes in living arrangements resulting in increasing
number of
older people living alone (about 30% of all non-institutionalized older
persons
in 2000 lived alone in the United States).
(5) Since older persons
have usually lower income and a higher proportion of them are living
below the
poverty line, population aging is associated with poverty, particularly
in
developing countries.
Projections of population aging in the 21st
century
Future population aging will depend on future
demographic trends, but most demographers agree that the fertility and
mortality changes that would be required to reverse population aging in
the
coming decades are very unlikely. According to current population
forecasts,
population aging in the first half of this century should exceed that
of the
second half of the 20th century. For the world as a whole,
the elderly
will grow from 6.9% of the population in 2000 to a projected 19.3% in
2050
(Table 1). In other words, the world average should then be higher than
the
current world record. All regions are expected to see an increase,
although it
should be milder in some regions, such as
If population aging is thus far from limited to
the most developed regions, the countries of these regions will likely
continue
to experience the highest proportions ever known. The forecasts suggest
29.2%
of elderly in the European population as a whole, but more than 30% in
a number
of specific European countries, and perhaps as much as 36.4% in
There is of course some uncertainty with any
forecast, but it is important to note that previous population
forecasts
underestimated rather than overstated the current pace of population
aging. Before the 1980s the process of population aging was
considered as
an exclusive consequence of fertility decline and it was predicted that
the
pace of population aging would decrease after stabilization of
fertility rates
at some low levels. Rapid decline in old-age mortality observed
in
developed countries in the last decades of the 20th century
significantly accelerated population aging. Now the old-age
mortality
trends are becoming the key demographic component in projecting the
size and
composition of the world's future elderly population. Current and
future
uncertainties about changing mortality may produce widely divergent
projections
of the size of tomorrow's elderly population. For example, the
U.S.
Census Bureau's middle-mortality series projection suggests that there
will be
14.3 million people aged 85 and over in the year 2040, while the
low-mortality
(i.e., high life expectancy) series implies 16.8 million.
Alternative
projections, using assumptions of lower death rates and higher life
expectancies,
have produced estimates from 23.5 to 54 million people aged 85 and over
in 2040
in the United States (see Kinsella, Velkoff, 2001).
Social
and economic implications of population aging
While population aging
represents, in one sense, a success story for mankind (massive survival
to old
ages has become possible), it also poses profound challenges to public
institutions that must adapt to a changing age structure.
The first challenge is
associated with dramatic increase in the older retired population
relative to
the shrinking population of working ages, which creates social and
political
pressures on social support systems. In most developed countries,
rapid
population aging places a strong pressure on social security
programs.
For example, the
Population aging is also
a great challenge for the health care systems. As nations age,
the
prevalence of disability, frailty, and chronic diseases (Alzheimer’s
disease,
cancer, cardiovascular and cerebrovascular
diseases,
etc.) is expected to increase dramatically. Some experts raise
concerns
that the mankind may become a “global nursing home” (Eberstadt,
1997).
The aging of the
population is indeed a global phenomenon that requires international
coordination of national and local actions. The United Nations
and other
international organizations developed recommendations intended to
mitigate the
adverse consequences of population aging. These recommendations
include
reorganization of social security systems, changes in labor,
immigration and
family policies, promotion active and healthy life styles, and more
cooperation
between the governments in resolving socioeconomic and political
problems posed
by population aging.
On the positive side,
the health status of older people of a given age is improving over time
now,
because more recent generations have a lower disease load. Older
people
can live vigorous and active lives until a much later age than in the
past and
if they're encouraged to be productive, they can be economic
contributors as
well. Also the possibility should not be excluded that current
intensive
biomedical anti-aging studies may help to extend the healthy and
productive
period of human life in the future (de Grey et al., 2002).
Word Count: 2,793
BIBLIOGRAPHY
Administration
on Aging. 2001. A
Profile of Older Americans: 2001.
De Grey,
Aubrey D. N., Leonid Gavrilov, S. Jay Olshansky, L. Stephen Coles, Richard G. Cutler,
Michael Fossel, and S. Mitchell Harman. 2002. “Antiaging
technology and pseudoscience.” Science,
296: 656-656.
Eberstadt, N. 1997. “World population
implosion?” Public Interest, 129: 3-22.
Gavrilov, Leonid A., and Natalia
S. Gavrilova. 1991. The Biology of Life Span: A
Quantitative Approach. NY, etc.: Harwood Academic Publ..
Kinsella, Kevin, and Victoria A. Velkoff.
2001. An Aging World: 2001.
U. S. Census Bureau, Series P95/01-1,
Lutz,
Wolfgang, Warren Sanderson, and Sergei Scherbow. 2001. “The end of world population growth.” Nature 412: 543-545.
United Nations 2001. World population prospects: the
2000 revision.
Table 1.
Dynamics of Population Aging in the
Modern World
Observed and Forecasted Percentages of the Elderly (65+
years) in
Selected Areas, Regions, and Countries of the World: 1950, 2000 and
2050.
|
Major Area, region and country |
1950 |
2000 |
2050 |
|
World |
5.2% |
6.9% |
19.3% |
|
Africa |
3.2% |
3.3% |
6.9% |
|
|
3.7% |
5.4% |
16.9% |
|
China |
4.5% |
6.9% |
22.7% |
|
India |
3.3% |
5.0% |
14.8% |
|
Japan |
4.9% |
17.2% |
36.4% |
|
Europe |
8.2% |
14.7% |
29.2% |
|
Italy |
8.3% |
18.1% |
35.9% |
|
Germany |
9.7% |
16.4% |
31.0% |
|
Sweden |
10.3% |
17.4% |
30.4% |
|
U.S.A. |
8.3% |
12.3% |
21.1% |
Source:
United Nations 2001.
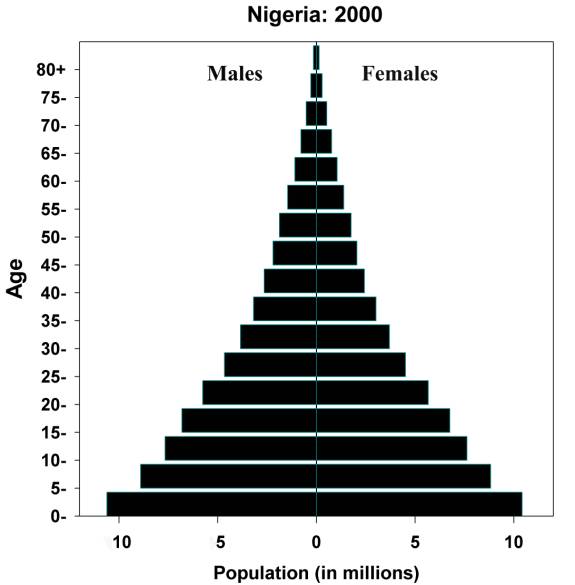
Figure
1. Youthful
population.
Figure
2. Aged
population.
Figure
3. Intermediate
population.
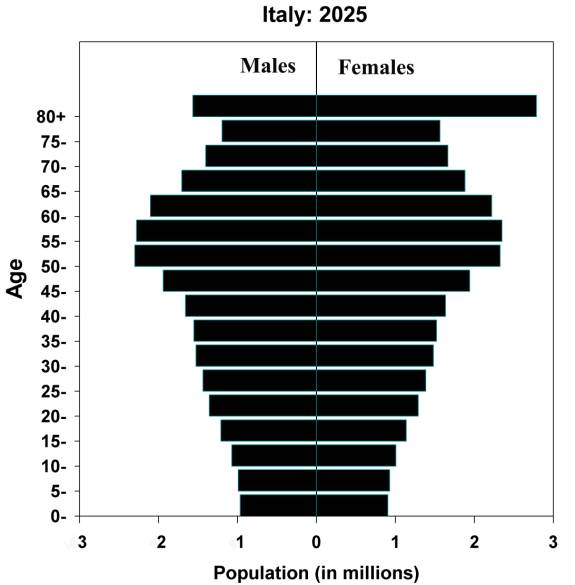
Figure
4. Projected
extremely old population.
Figure
5. Projected
old population.